Article

Income Vulnerability of West African Farming Households to Losses in Pollination Services: A Case Study from Ouagadougou, Burkina Faso

by
Kathrin Stenchly
1,*,
Marc Victor Hansen
2,
Katharina Stein
3,
Andreas Buerkert
1 and
Wilhelm Loewenstein
2
1
Organic Plant Production and Agroecosystems Research in the Tropics and Subtropics (OPATS), Universität Kassel, Steinstrasse 19, 37213 Witzenhausen, Germany
2
Institute of Development Research and Development Policy, Ruhr-Universität Bochum, 44801 Bochum, Germany
3
Institute of Biological Sciences, Department of Botany and Botanical Garden, University of Rostock, 18051 Rostock, Germany
*
Author to whom correspondence should be addressed.
Sustainability 2018, 10(11), 4253; https://doi.org/10.3390/su10114253
Submission received: 25 October 2018 / Revised: 11 November 2018 / Accepted: 15 November 2018 / Published: 17 November 2018
(This article belongs to the Section Sustainable Urban and Rural Development)

Abstract

:
Urban and peri-urban agriculture (UPA) in West African countries is developing rapidly in response to population growth and changing consumer preferences. Furthermore, UPA offers opportunities to secure income and social integration for the urban poor. However, little is known about household (HH) income security effects of the ongoing shift in UPA land use from crops that do not rely on insect pollinators for fruit development (e.g., sorghum and millet) to pollinator-dependent crops. In our study we developed a Household Vulnerability Index (HVI) for 224 HHs along a rural–urban gradient of Ouagadougou, Burkina Faso. The HVI indicates to which degree total HH revenue could be affected by a decline in insect pollinators. HH specific relative reduction of agricultural revenue ranged from 0 to −0.83, a reduction in HHs’ revenue of up to 83%, depending on the crops’ level of pollinator dependency. Half of the studied HHs (n = 108) showed an HVI of 0 and remained unaffected by a decline in pollinators. Nevertheless, mean HVI was highest for urban HHs; making these HHs most vulnerable for loss of pollination services. As in urban areas changes in insect-mediated pollination services are expected, the development of resilient UPA systems must consider “pollinator-friendly” landscape management.

Graphical Abstract

1. Introduction

The decline of wild and domesticated pollinators may particularly affect the world’s poor who strongly rely on biodiversity and ecosystem services for food and income security [1,2]. Over 2 billion people in developing countries are smallholder farmers, often heavily reliant upon pollination services [3]. Pollination deficits (reduced yield as a result of insufficient pollination) have already been detected in a variety of crops across the developing world [1,4].
For millennia agricultural productivity in sub-Saharan Africa has suffered from bio-physical constraints such as soil acidity, nutrient depletion, degradation of agricultural land, and climate variability. After the severe droughts of the 1970s and 1980s, many farmers in Burkina Faso adopted horticultural production as a strategy to increase household (HH) resilience [5]. However, with the shift in agricultural land use from crops that do not rely on insect pollinators for fruit and seed development such as sorghum (Sorghum bicolor Moench), millet (Pennisetum glaucum (L.) R.Br.) and maize (Zea mays L.) to crops in which pollinating insects contribute significantly to fruit quantity and quality, it may well be that West African (WA) farmers’ livelihoods and food security will be increasingly affected by future losses in biodiversity [6]. Driven by high urbanization rates in West Africa, the predominant staple food production in rural areas is increasingly complemented by urban and peri-urban agricultural (UPA) systems that are characterized by an intensive, market-oriented, and diverse horticultural production.
The ecosystem service of pollination provides economic value to crop production by increasing the quantity and quality of the crops produced, resulting in greater economic output [7]. Depending on the degree to which farmers’ produce relies on insect pollination for optimum yield, which in turn depends on the degree of floral self-compatibility and the ability for self-pollination [8], the vulnerability of rural, peri-urban, and urban HHs may increase with urbanization-induced land use changes. To estimate the dependency of farming HHs on the ecosystem service of pollination, the deficit approach, which aims at quantifying yield effects of pollination, is commonly used [9]. Studies that assessed the economic value of pollination services on a global scale showed that agriculture has become more pollinator-dependent over time and that this trend is more pronounced in the developing than in the developed world [10]. Following statistics of the Food and Agriculture Organization of the United Nations (FAO), the insect pollination economic value (IPEV) for West Africa is estimated at 5.6 billion US dollars, which is the highest on the African continent along with one of the highest vulnerability rates in terms of pollination (i.e., IPEV/total production economic value; [11]). Furthermore, based on FAO dataset [12] and following the methodology of Aizen et al., the expected agriculture losses in the absence of animal pollination in 2012 ranged from 5% to 7.5% in Burkina Faso and even from 7.5% up to 15% in the neighboring countries Mali and Ivory Coast [13,14].
Most studies focused on the economic valuation of pollinator services at the large scale [8,11,15] or on cash crop production [16,17]. Estimates of the impact of pollinator losses on the resilience of African smallholder HHs that are exposed to multiple risks, however, are still scarce [18,19]. In order to assess the households’ capacity of farmers in and around Ouagadougou to cope with yield losses caused by a decline in insect pollination service, we calculated a Household Vulnerability Index (HVIi). Hereby we considered pollination as an input to crop production [9] and estimated which consequences its total loss could have on HHs’ agricultural revenue and hence on HH income, the effects of a more likely partial pollination loss are also discussed. As urban and peri-urban farmers are often specialized on one or two crops [20] which heavily rely upon insect pollination and from which they earn most of their total income, it can be assumed that HHs income security of urban farmers will be strongly affected by pollinator losses.

2. Materials and Methods

2.1. Study Area

The study was conducted around the capital of Burkina Faso, Ouagadougou which in 2018 covered an area of 2800 km2 and contained about 1.1 million inhabitants (World Population Review 2018). The climate is hot semi-arid with an annual mean temperature of 28 °C and a total unimodally distributed annual precipitation of around 750 mm concentrated from May to early October [21].
In total, 16 study sites were selected in and around Ouagadougou that comprised rural agricultural systems (n = 4), peri-urban systems (n = 4), and urban systems (n = 8). Urban sites had equal shares of HHs practicing market-oriented open-space farming and those using backyard systems predominantly used for auto-consumption. The degree to which sites were already urbanized (peri-urban systems) was determined through the calculation of an Urban–Rural Index (URI) based on building density and travel time to the city center ranging between 0 (least urban) and 1 (most urban) [22]. Study sites around Ouagadougou with an URI between 0 and 0.3 were classified as rural, between 0.31 and 0.6 as peri-urban, and those sites with an index of >0.61 as urban. Expressed in distances, rural, peri-urban, and urban sites were situated at an average linear distance of 55 km, 19 km, and 6 km, respectively, from the geographical city center of Ouagadougou.
At each study site we defined spatially independent 300 × 300 m patches (in total 43) of which we determined the pollinator dependency of the cultivated crop species on separate fields in conjunction with farmers’ input cost, revenue, and farmer’s household socio-economic situation using a standardized, semi-structured questionnaire. A total of 224 farmers from rural, peri-urban, and urban HHs were interviewed who all together cultivated 378 fields. For urban areas we differentiated between HHs that cultivated crops on free space next to their residence, in the following referred to as backyard farming, and HHs that cultivated crops on open-space farming areas that were accessible to the public for market-oriented agricultural production. Field size was calculated within geographic information system application [23] using coordinates from the borders of each field collected by a hand-held GPS (®Vista HCx eTrex, GARMIN Ltd., UK, accuracy ± 2 m).

2.2. Farmers’ Inputs, Cost, Revenue and Household Status

Farmers were interviewed about each field separately to collect information about their management strategies in the previous year 2015, namely cultivated crops, applied amount and type of soil amendment (mineral fertilizer, manure and/or compost), usage of insecticides and weedicides, seed source, cultivation season, irrigation water source, as well as cropping pattern and intercropping schemes (Table S1). Subsequently, we asked farmers for their real costs of field inputs in 2015 such as fertilizers, insecticides, weedicides, seeds, and additionally for irrigation water when plots were cultivated during the dry season. In conjunction with yields that farmers obtained per field and crop, farmers’ HH characteristics comprising the number of family members grouped by age and gender, total annual HH income, and proportion of income derived from marketing of agricultural production were also recorded. For each HH the age dependency ratio was calculated by dividing the number of members younger than six years by the number of people older than six years of age. This ratio is a measure of the age structure of a household and it relates the number of dependent family members to the support of others. The particular threshold was chosen as within West African countries children from the age of six often contribute substantially to household sustenance including caring for siblings, helping with household chores, tending family farm, feeding animals, and fetching water [24].

2.3. Insect Pollinator Dependency of Produce

Cultivated crop species were classified according to their dependence on insect pollination for fruit development into five categories that describe a reduction in production by a specific percentage collected from experiments with and without insect pollination (Klein et al., 2007; Table S2). No pollinator dependency (PD) described produce with no reduction in yield following pollinator exclusion (PD = 0; simulated pollinator loss). Low PD indicates a potentially reduced production by up to 10% if pollinators are absent (0 < PD ≤ 10), moderate PD indicates a reduction of 10% to 40% in the absence of pollinators (10 < PD ≤ 40) and a high PD was assigned to crop species that strongly depends on insect pollinators, i.e., a reduction of between 40% and 90% will occur following total pollinator loss (40 < PD ≤ 90). The last level describes produce for which insect pollination is essential (essential PD) and for which yield may be reduced by up to 90% or more in the absence of insect pollinators (90 < PD ≤ 100). To estimate the variation in data on pollinator dependency two pollinator dependency levels were used for each crop, a minimum and a maximum estimation of the reduction in yield following total pollinator loss (see Klein et al., 2007). For example, pollinator dependency for the high PD category ranged from 40%–90%.

2.4. Household Vulnerability Index (HVI) for Total Loss in Pollination Service

Taking households’ characteristics and marketing strategies as well as variations in the pollinator dependency of the cultivated crops into account, we developed a Household Vulnerability Index (HVI) that describes the theoretical reduction in HHs’ annual income caused by total pollinator loss. This HVI, based on household income data from 2015, indicates the potential future risk (vulnerability) for loss of income of rural, peri-urban, and urban households.
A farming household (i) may produce a quantity X i , j of the agricultural good j by combining capital ( K i , j ), labour ( L i , j ), and land ( Land i , j ) subject to a household-specific total factor productivity ( A i ). In addition to the levels of these classical input factors, the level of pollinator services ( PS i , j ) available to household i for the production of good j positively influences the quantity of good j. Consequently, the household production function can be defined as follows:
Equation (1): Household Production Function
X i , j = X i , j ( A i , K i , j , L i , j , Land i , j , PS i , j )
The total differential of the production function illustrates how alterations in the factor input quantities and the level of pollination services affect the quantity of good j produced by household i:
Equation (2): Total Differential of the Household Production Function
dX i , j = X i , j A i dA i + X i , j K i , j dK i , j + X i , j L i , j dL i , j + X i , j Land i , j dLand i , j + X i , j PS i , j dPS i , j
The monetary value of the farm output of household i ( Y i fa ) is the sum of the products of the market price at which good j could be sold ( p j ) and the quantity of good j that household i produced according to Equation (1):
Y i fa = j = 1 J p j · X i , j
Due to the prevalence of auto-consumption of HH production, especially in rural populations, X i , j represents the total quantity of good j produced and not merely the total quantity of good j sold so that the monetary value of the farm output includes revenues from sales as well as the monetary value of self-consumed agricultural output. An HH’s total revenue ( Y i ttl ) is the sum of the monetary value of the farm output ( Y i fa ) and of the revenues generated by other activities. Dividing the monetary value of the farm output by total household revenue ( Y i ttl ) yields an expression for the proportion of total revenue resulting from the production of each individual good j ( p j · X i , j Y i ttl ).
The HVI is thus the sum, across all agricultural products, of the products of the portion of total household income derived from the cultivation of a particular product ( p j · X i , j Y i ttl ) and the change in output per unit of land resulting from a change in pollination services ( X i , j PS i , j dps i , j ):
Equation (3): Household Vulnerability Index (HVI)
HVI i = j = 1 J p j · X i , j Y i ttl X i , j PS i , j dPS i , j ;   1 HVI i +
Thereby, the HVI i for each household can take values from −1, where the household loses all its income following a dramatic decline in pollinator services, through 0, where an HH’s revenue is unaffected by changes in pollinator services. In a scenario where abundance and diversity of pollinators and their services are enhanced for a field or a particular HH, the HVI i may take positive values indicating an increase in total HH revenue due to augmentation of pollinator services. However, due to the given alarming trend of pollinator decline worldwide this study is based on an assumption of a potential loss of pollinator services, thus positive HVI i values are impossible in that context.

2.5. Calculation of HVI and Statistical Analysis

Differences in mean HVI for different HH types (rural, peri-urban, urban) were tested for statistical significance using linear mixed-effect models (LMER) with site as a random grouping factor. Multiple comparisons were conducted using a Tukey test at p ≤ 0.05 as the significance threshold. LMER was used to test for potential correlations between HVI and household characteristics such as income sources, crop diversity, and age dependency ratio. All calculations were made using Stata Corp [25] (HVI) and R version 3.3.0 [26] (LMER) with additional functions provided by the R packages lme4 [27], lmerTest [28], and multcomp [29].

3. Results

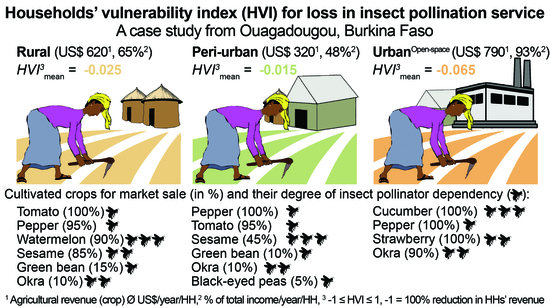
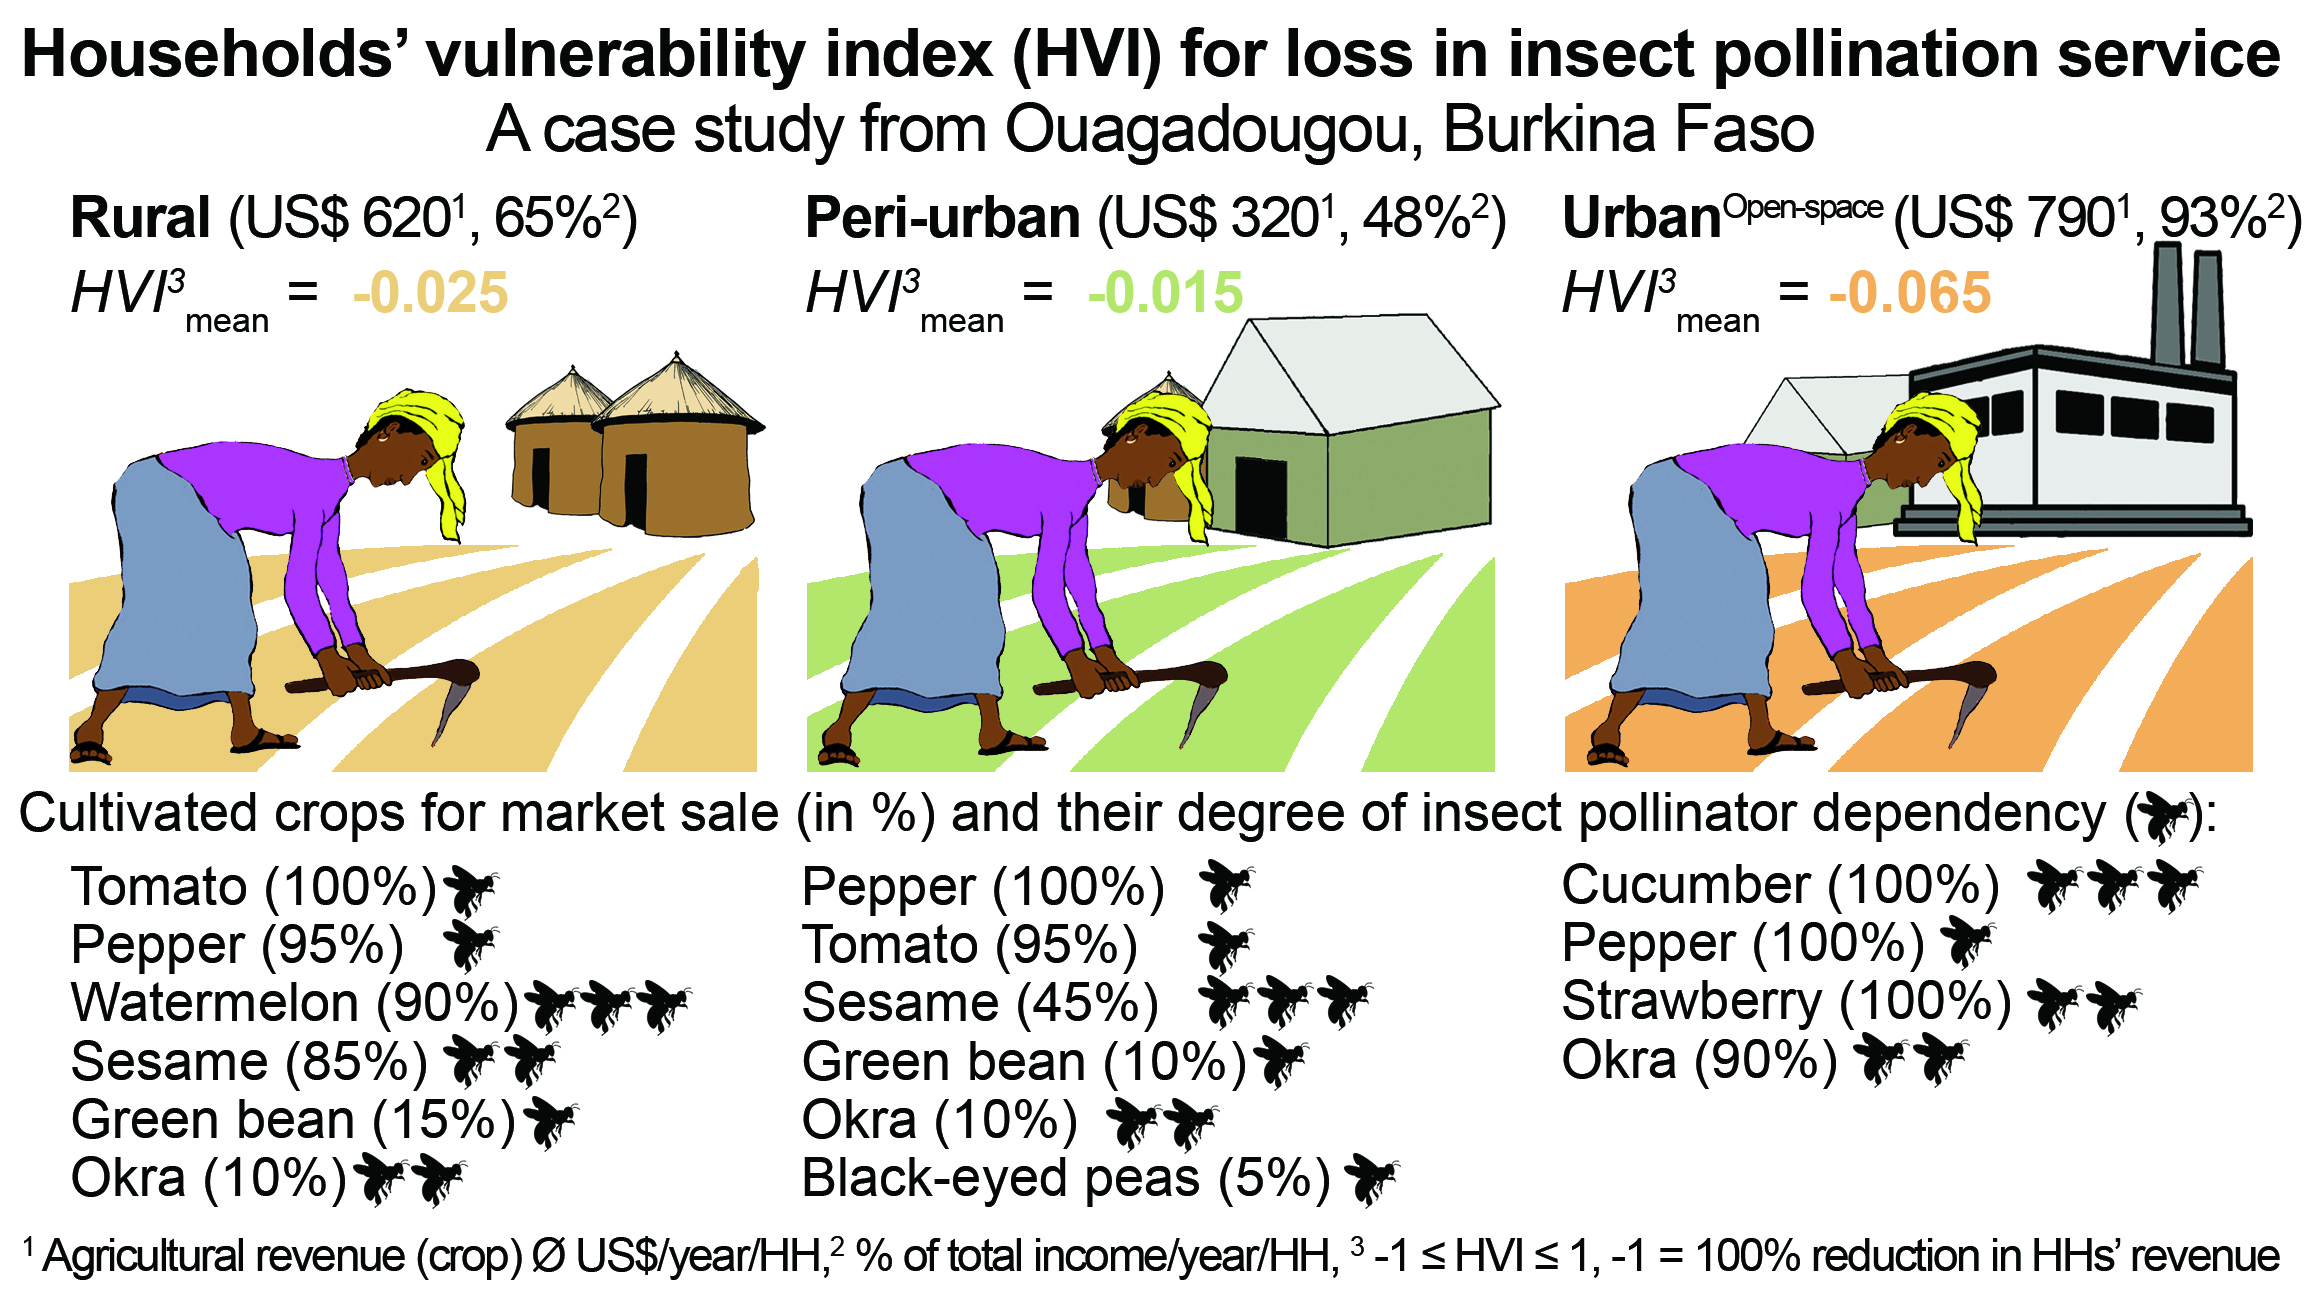
3.1. Agricultural Systems and Household Characteristics

In total 38 different crops and horticultural produce were cultivated by the 224 interviewed households along the rural–urban gradient of Ouagadougou. The average number of different crops and horticultural products cultivated per household was with four species highest for rural HHs. Peri-urban and both urban HH types cultivated, on average, two crop species per year. Rural agricultural systems around Ouagadougou were characterized by a high proportion of land under cultivation with pollinator non-dependent cereals such as millet (40% of the studied area) and sorghum (30%), but in conjunction with green bean (Vicia faba L.). Also fields with maize (10%) and groundnut (Arachis hypogaea L.; 8%) were frequent in rural systems. Peri-urban production systems were similar to rural ones and characterized by a high proportion of land under sorghum (35%) and millet (20%) in conjunction with green bean, as well as with cowpea (Vigna unguiculata (L.) Verdc.; 12%) and groundnut (10%). Urban households primarily cultivated maize (30%), okra (Abelmoschus esculentus (L.) Moench; 20%), green bean (15%), and millet (10%) within their backyards. In contrast, most land of the open-space farm systems in Ouagadougou was used for the cultivation of okra (25%), spinach (Spinacia oleracea L.; 18%), lettuce (Lactuca sativa L.; 14 %), amaranth (Amaranthus spp.; 10%), strawberry (Fragaria x ananassa Duchesne; 10%), and cucumber (Cucumis sativus L.; 8%).
The average annual revenue of rural HHs derived from marketing of their agricultural produce was 380,000 XOF (West African CFA franc; ≈US$620 or 65% of total household income), of peri-urban HHs 190,000 XOF (≈US$320 or 48% of total household income), of urban HHs with backyard cultivation around 300,000 XOF (≈US$480 or 48% of total household income) and urban HHs cultivating in open-space systems around 500,000 XOF (≈US$790 or 93% of total HH income).
Average number of HH members was highest within rural areas with 15 members per HH. Here, average HH age dependency ratio amounted to 0.37. Peri-urban HHs had on average 12 members, urban HHs 9 (backyard), and 10 (open-space) members, respectively. The HH age dependency ratio was with an average of 0.25 similar for peri-urban and both urban HH types.

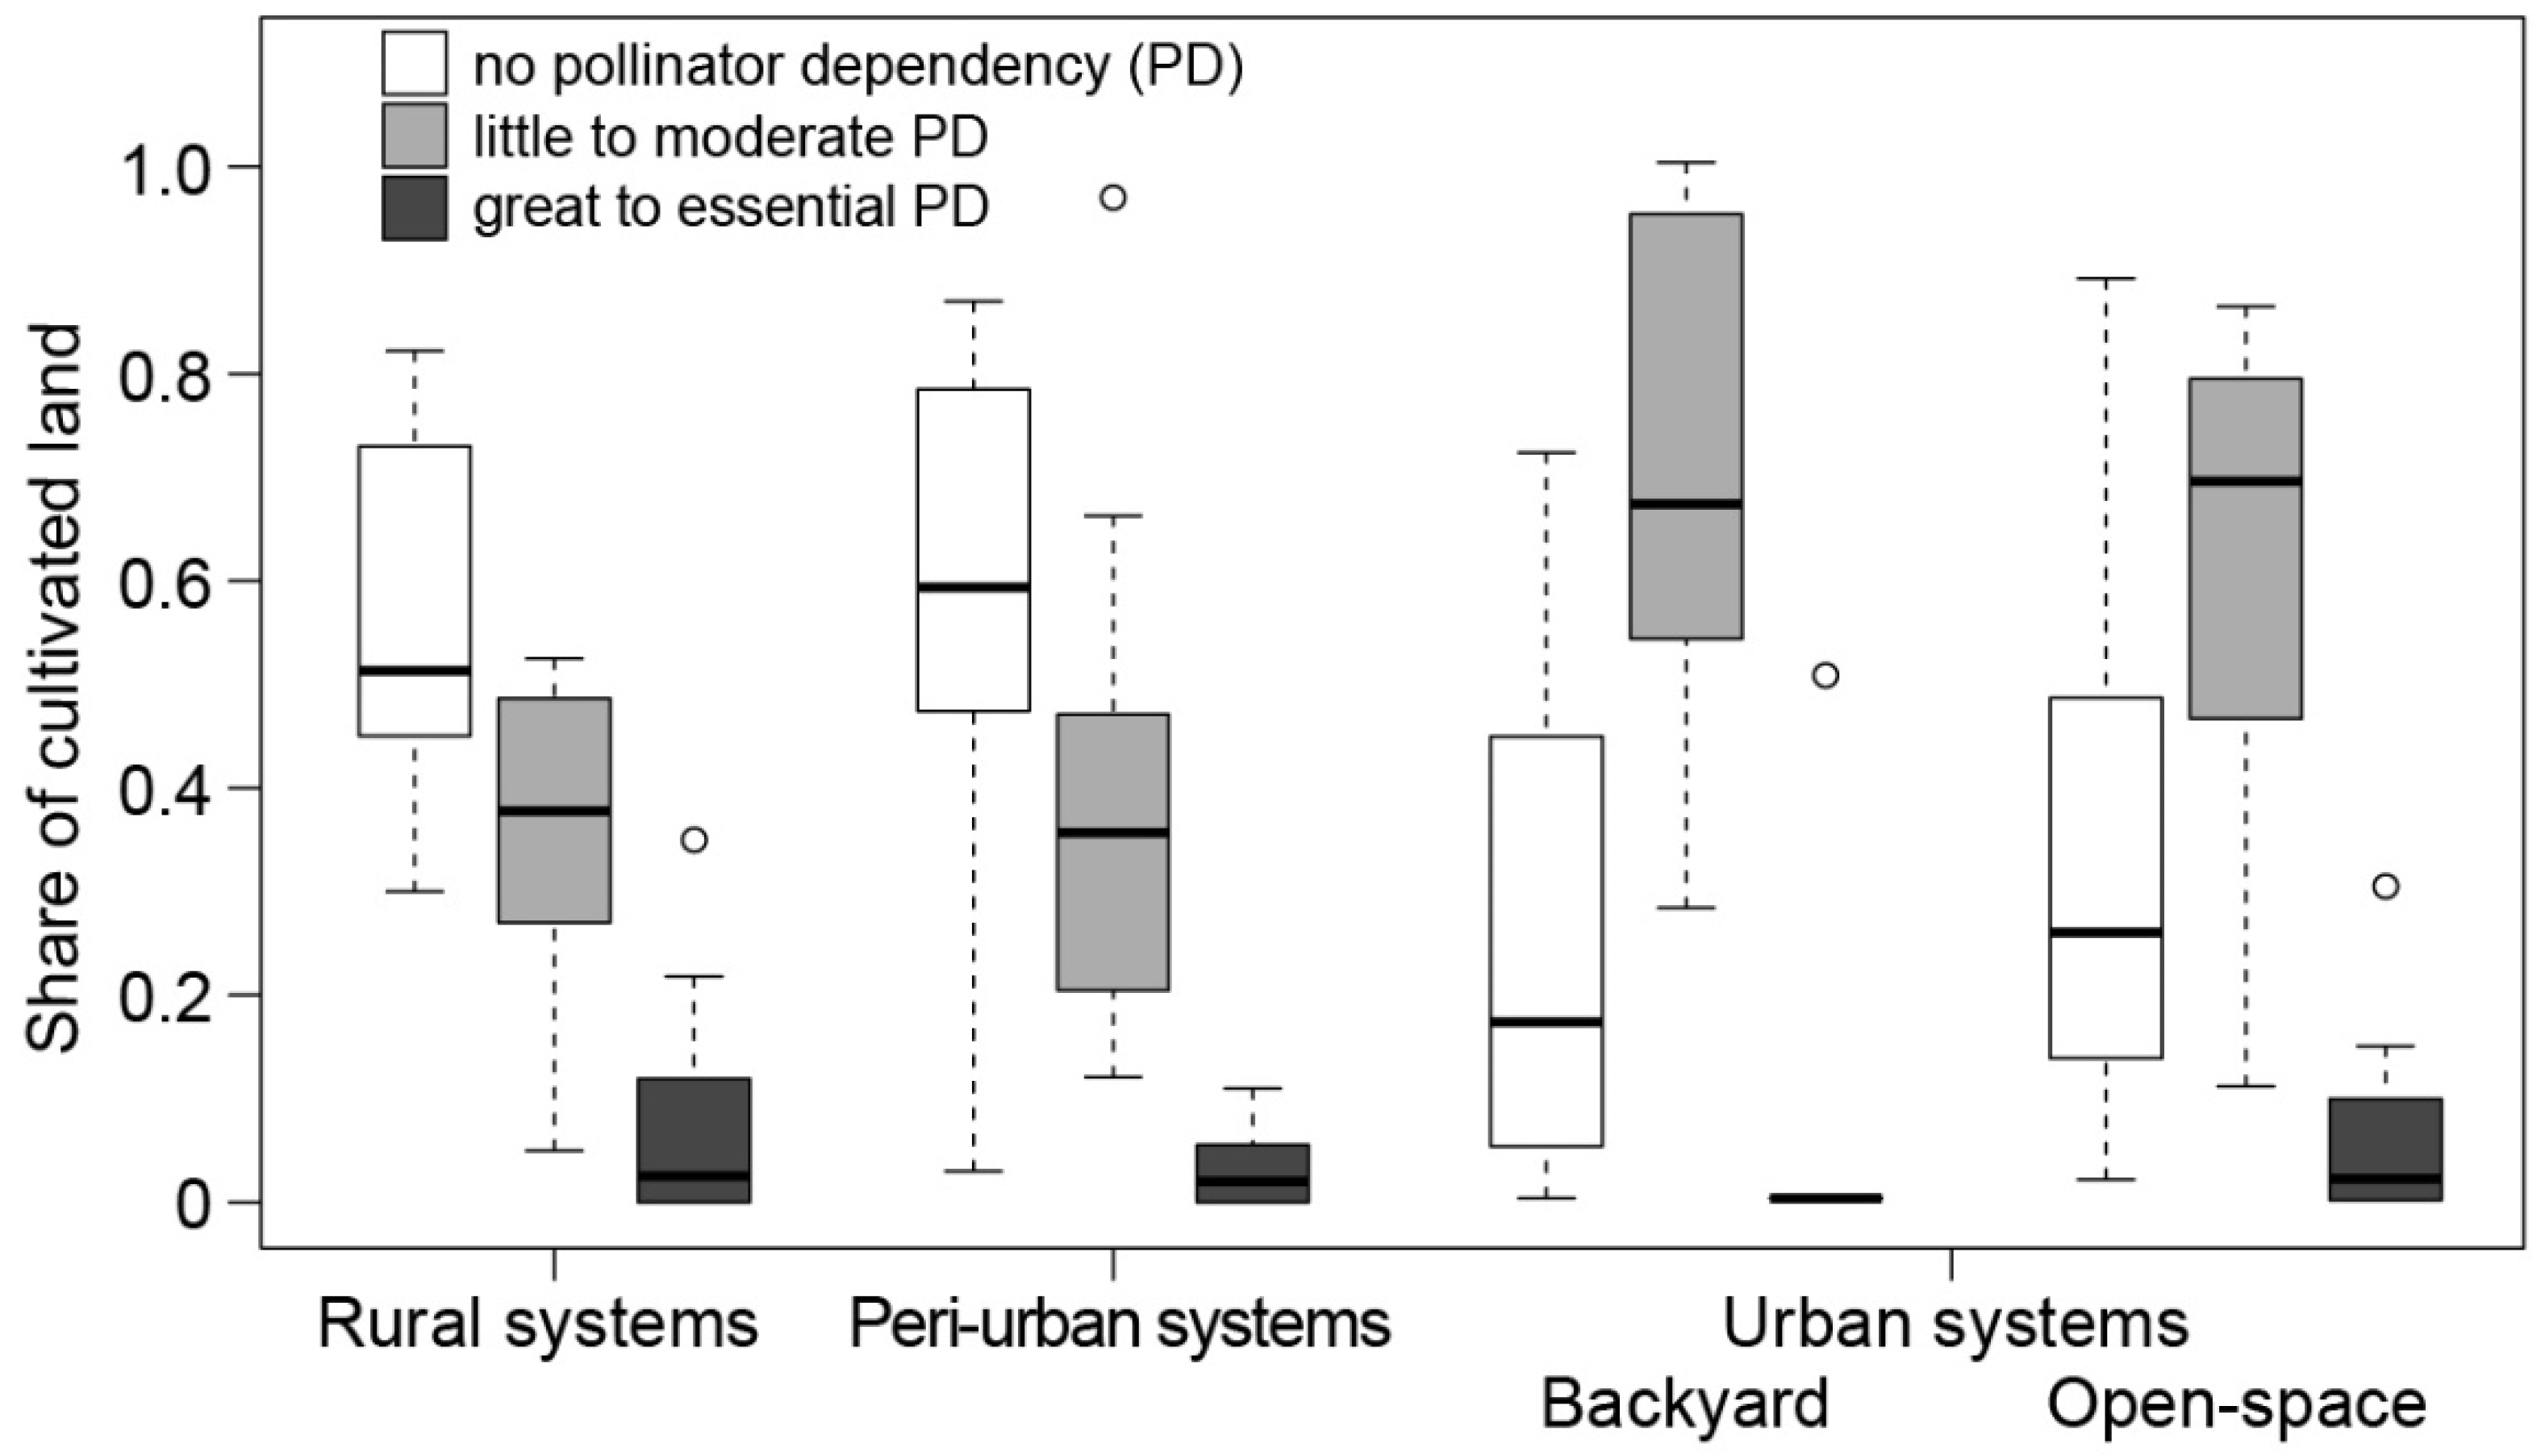
3.2. Changes in Cultivation of Pollinator-Dependent Crops along the Rural–Urban Gradient

The proportion of land cultivated with crops that did not rely on insect pollination for fruit development was significantly higher for rural and peri-urban systems than for both types of urban farming systems (F3,9 = 4.15, p = 0.04; Figure 1). This shift resulted in an increased area under cultivation with crops known to benefit to a small and moderate degree from insect pollination within urban areas (F3,39 = 5.04, p = 0.005). Farmers of rural, peri-urban, and open-space systems used the same proportion of land for crops that highly depend or even fully rely on insect pollination for their fruit and seed development.
Around 25% (n = 10) of the cultivated crops and horticultural products were dependent on insect pollination (Table 1). Average field size as well as average yield per crop differed widely along the rural–urban gradient and were unrelated to market orientation of crop cultivation. Whereas cucumber and strawberry were exclusively cultivated in urban farming systems, green bean was cultivated in all systems, with the exception of urban open-space farming. Okra was cultivated regularly by farmers for self-consumption along the rural–urban gradient but also in market oriented open-space systems. Horticultural produce as cucumber, pepper (Capsicum spp. L.; rural to urban systems), strawberry, tomato (Solanum lycopersicum L.; rural to urban systems), and watermelon (Citrullus lanatus (Thunb.) Matsum. & Nakai; rural systems) were preliminary cultivated for markets, whereas cowpea and green bean were cultivated for self-consumption.

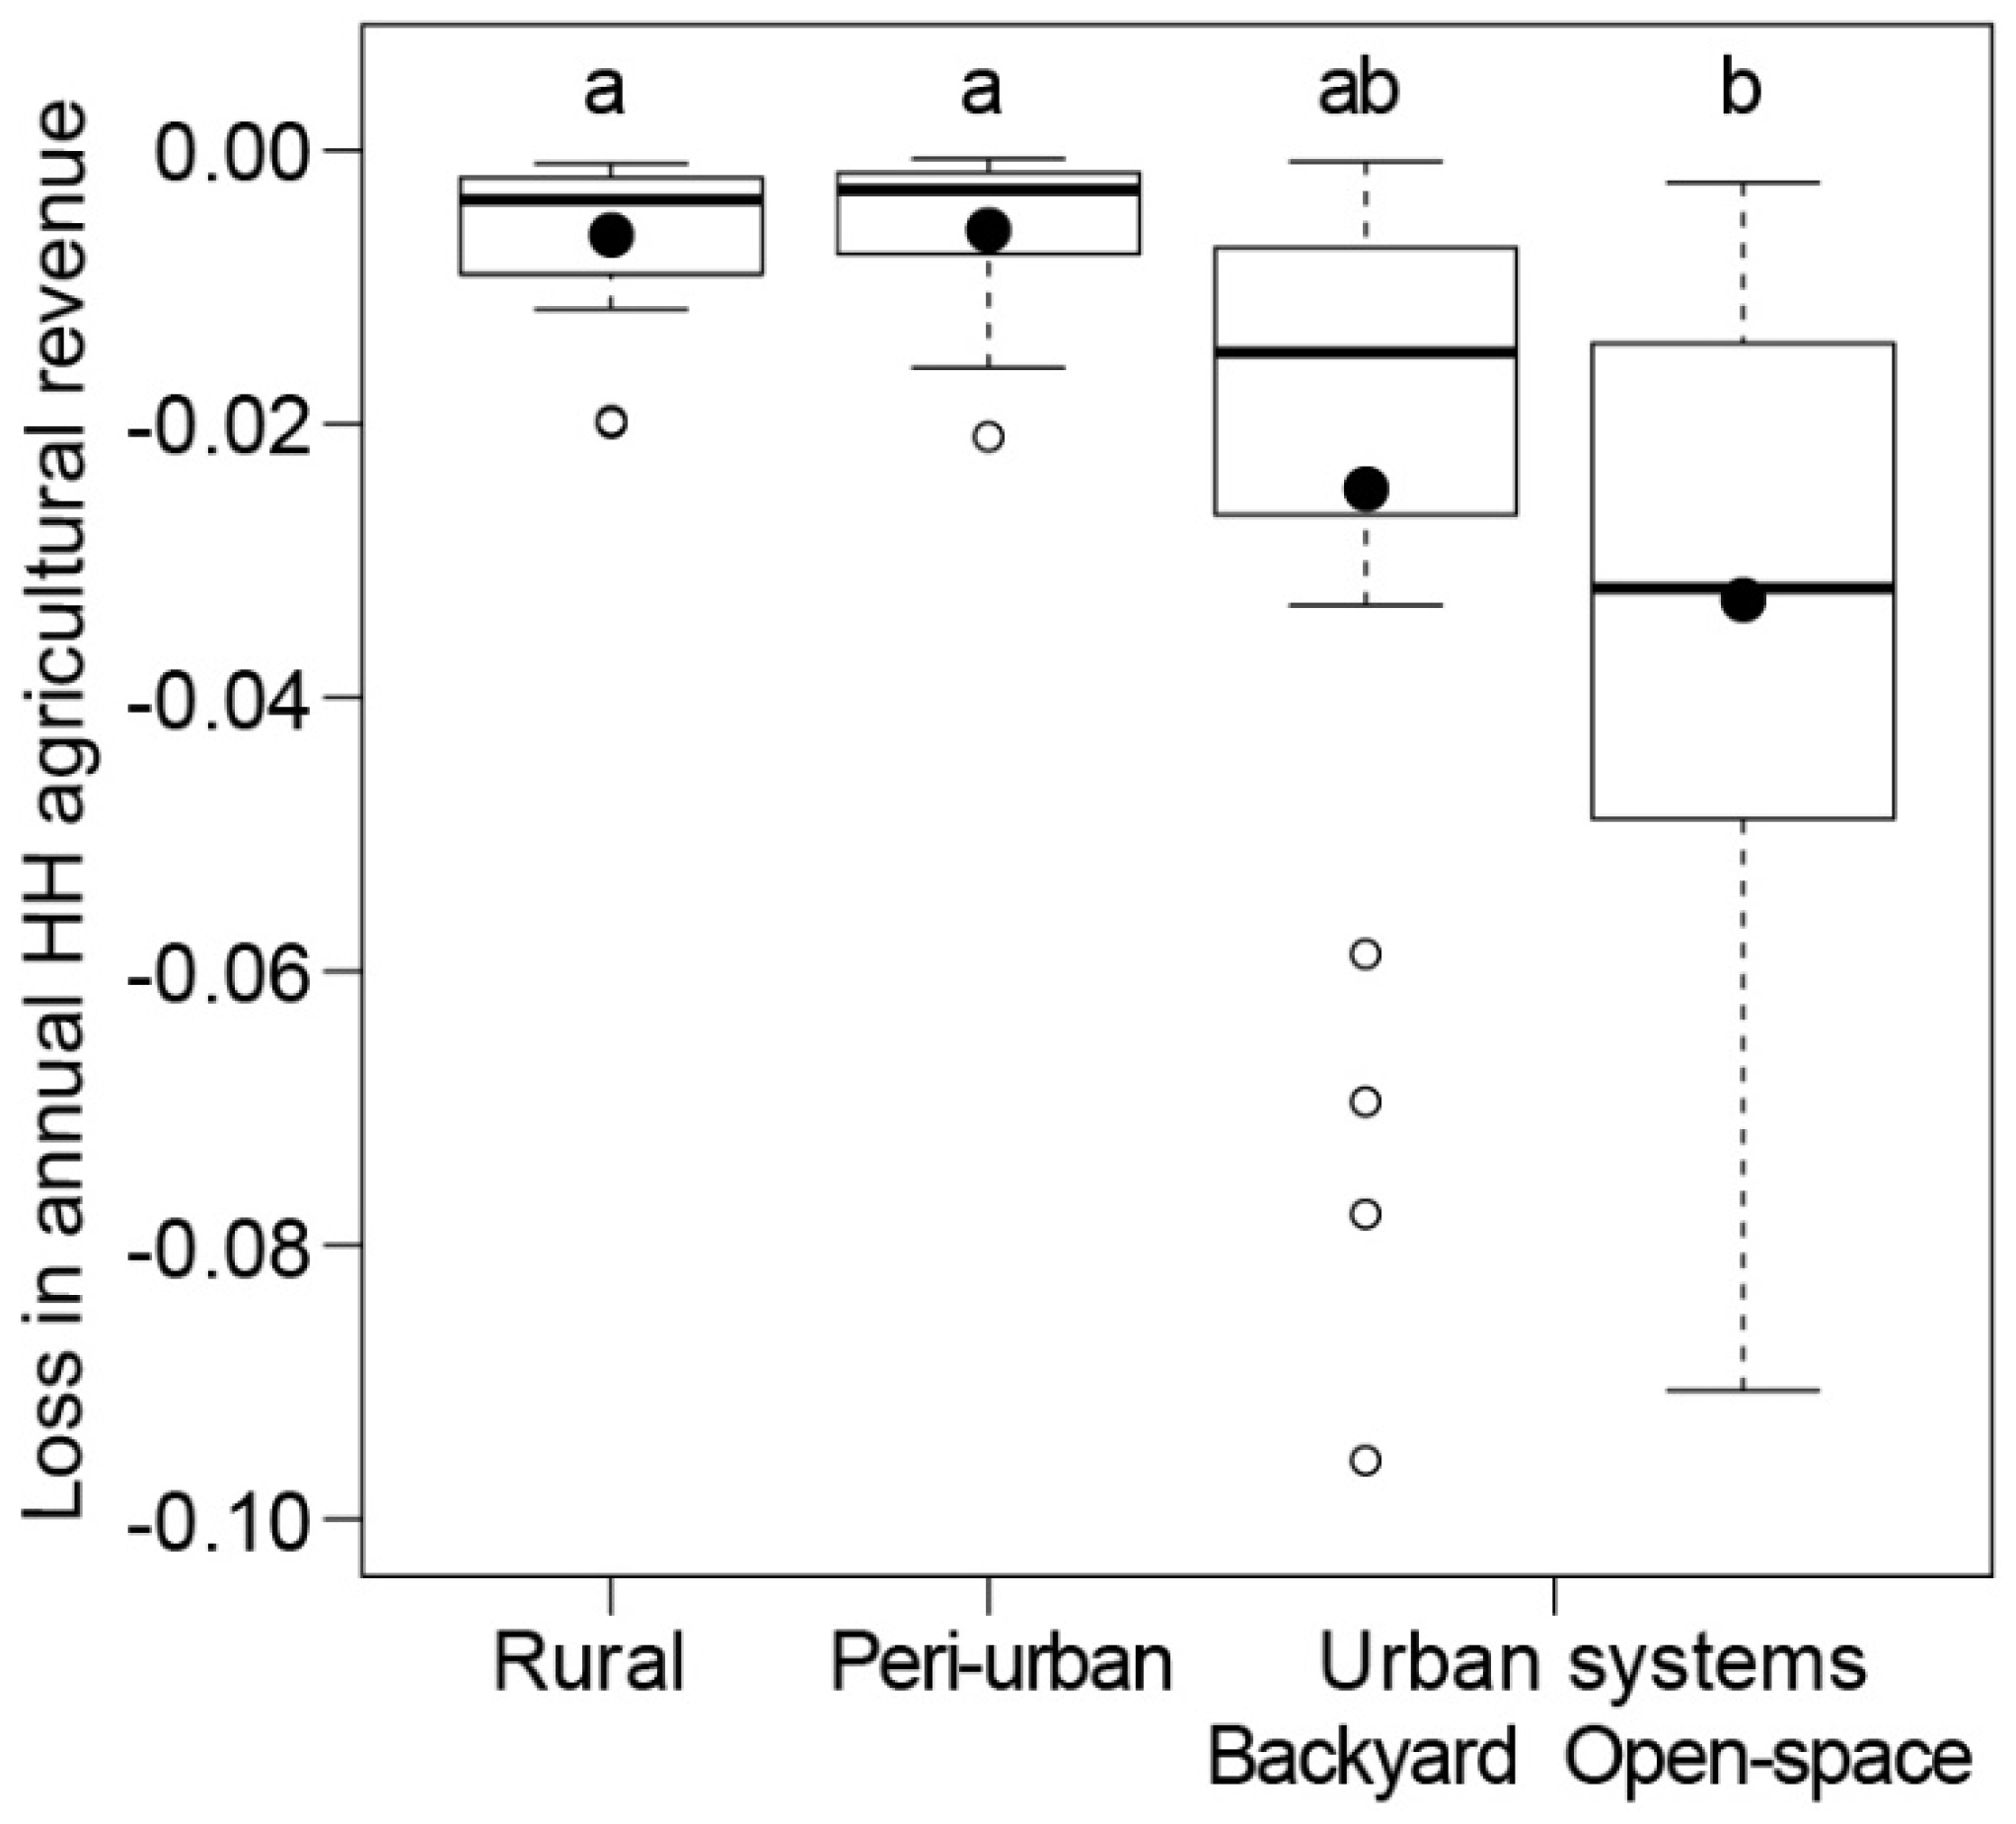
3.3. Effects on Household Revenue and Vulnerability

At the lowest pollinator dependency of the cultivated crops and horticultural products, HVI for farmers in and around Ouagadougou ranged from 0 to −0.55. At the crops’ maximum pollinator dependency, HVI reached up to −0.83, meaning a maximum reduction of their current HH revenue from crop cultivation and sale by up to 83%. However, 48% (n = 108) of the studied HHs, mostly urban and peri-urban ones, showed an HVI of 0 and remained unaffected by a decline in pollinators. The average HVI was therefore low and did not change significantly along the rural–urban gradient (F3,12 = 0.52, p = 0.68; Table 2). Still, more than half of the studied HHs seemed vulnerable to pollinator loss to a certain degree. Peri-urban HHs would be least affected with 1% loss and urban HHs would be strongest but not seriously affected with an average loss of 3% (maximum of 10%) of their current revenue from horticultural production.
Farming households involved in the market-oriented cultivation of cucumber, strawberry, okra, and sesame may be most affected by pollinator decline and could experience a reduction in HH income of around 27% (maximum of 30%) if specialized in cucumber production. Strawberry farmers may lose between 9% and 25% of their current annual income, sesame (Sesamum indicum L.) farmers between 3% and 6% and okra farmers between 2% and 8%. Here, with the shift in okra cultivation from self-consumption to marketing we observed that the contribution of okra production to HHs’ revenue and consequently to famers’ HVI changed along the rural–urban gradient (F3,12 = 5.9, p = 0.01; Figure 2).
Nevertheless, from the 224 interviewed HHs in and around Ouagadougou, only three urban HHs could be classified as strongly affected as they would lose more than 50% of their household income by total pollinator loss. Further 20 HHs that were also mainly active in urban open-space farming could be classified as moderately affected as they would lose between 20% and 50% of their household income by total pollinator loss. Except for HH location, no other factors such as number of income sources, crop diversity, or household age dependency ratio correlated with the HVI for pollinator loss.

4. Discussion

Rural and peri-urban agricultural landscapes in Burkina Faso are dominated by small-scale farmers cultivating less than 3 ha and largely practising subsistence agriculture using the staple crops sorghum, millet, and maize [30,31]. With shorter distances to markets and urban infrastructure, namely streets, water catchments, wells, and channels but also productive resources such as seeds, fertilizers, and pesticides, agricultural systems in and around Ouagadougou are characterized by higher crop diversity including species with perishable and high-value fruits such as cucumber and strawberry. Rural and open-space agricultural systems were similar in that both systems generated the highest HH income share derived from agricultural production. In contrast, urban open-space farmers practised market-oriented agriculture to cover their cost for food and living year-round. Average crop diversity per HH, however, was twice as high in rural areas compared with the other three regions, probably an effect of the limited and restricted access to vacant land and land tenure insecurity for urban and peri-urban farmers in and around Ouagadougou [32,33].
Peri-urban regions of West African cities constitute an area of particularly high transformation dynamics in space and time, and residents employed a mix of both urban and rural livelihood strategies [33]. Therefore, the vulnerability to pollinator losses of peri-urban and particularly of urban backyard farming households seemed to be lower than of rural ones due to diversified income sources such as livestock and self-employment. In contrast, a study in the catchment area of Ouagadougou by Chagomoka et al. (2015) revealed the highest risk of households’ food insecurity for peri-urban areas compared to urban and rural areas, presumably since peri-urban areas suffered from poor infrastructure, small markets, and poor access to water [34]. The results show the complex nature of peri-urban areas within developing countries which is associated with an influx of people from urban and rural areas leading to increasing demand for land for non-agricultural and urban land uses.
Within West African countries urban growth and agricultural intensification can trigger changes in biodiversity leading to either a homogenization or a reduction of important insect communities affecting the ecosystem service of pollination [35,36,37,38,39]. The fact that urban farming households in Ouagadougou were highly specialized in the cultivation and marketing of crops which often rely substantially upon insect pollination and from which they earn most of their total household income, made these households vulnerable to loss of pollination services by insects. This increase in risk of agricultural income loss due to a lack of pollination services from the rural to the urban space was particularly evident for okra where the importance of its cultivation for HH revenue was highest for urban farmers. In addition horticultural products such as cucumber and strawberry were primarily cultivated within urban areas due to farmers’ free access to water and agricultural resources. These crops also rely on insect pollinators for successful fruit development, and therefore had the greatest effect on farmers’ HH vulnerability. For both high-value products the urban market demand is currently large and ensures that farmers have a regular source of income [7], as long as pollination service is ensured. Although pollinator dependency of green beans is known to be small (potential yield reduction by up to 10% if pollinators are absent), a decline in pollination service would affect all households along the rural–urban gradient of Ouagadougou as this crop is almost ubiquitously cultivated by farmers and constitutes an important component of the HH diet [40]. Hence, a decrease in crop yield would lead to insufficiency to meet household consumption needs, let alone provide surplus for sale. The high standard deviation of HVIs’ mean, however, implied that HHs showed a high variability in their vulnerability depending on farmers’ crop dependency on pollination and the percentage of total HH income attributed to proceeds from the crop sale.
Farmers in Sub-Saharan Africa are particularly vulnerable to any reductions in crop productivity as they cultivate very small parcels of land and have to cope with a considerable yield gap whose size strongly varies from year to year [6,41]. Hence, the productivity of smallholder agriculture and its contribution to HH economy, food security, and poverty reduction highly depends on the services provided by well-functioning ecosystems, including pollination [3,42].
However, the data set used here constitutes only a ‘snapshot’ of the region (Ouagadougou) and is limited to a single time period (HH data solely from 2015). Hence, our findings cannot be considered as a fully realistic scenario and more detailed studies are certainly needed to assess real pollination effects on HHs’ vulnerability. Nevertheless, recent work by Stein et al. (2017) also showed that a deficit in pollinator abundance and diversity can lead to a significant loss in WA farmers’ income. They reported a reduction of up to US$75 in sesame and of US$155 in cotton (Gossypium hirsutum L.) farmers’ revenue in Burkina Faso. Future investigation of potential impacts of crop variety on pollination is important, since different crop varieties can exhibit different levels of pollinator dependence and possible yield deficits [43,44]. We further did not take into account potential effects of insect pollinator losses on fruit trees that are used by farmers and urban residents or the quantity and quality of seeds used for planting, which is an economically relevant factor for many WA farmers. Seeds are often locally multiplied to reduce production cost or for sale on the market [45]. Neither could we integrate an assessment of insect pollinator losses for African indigenous vegetables as data of their pollinator dependency was not available nor for forage crops, which may affect livestock production.
Also, our study assumed a total loss of pollinators rather than a gradual decline. Consequently, this analysis entails an estimation of the maximum potential impact of pollinator loss on farming HHs’ revenue. Furthermore, we used literature data to obtain crops’ dependency on insect pollination that, however, showed a high heterogeneity [11]. Consequently, we decided to use minimum and maximum values that resulted in a wide range in the HVIs.
Hence, an economic quantification of market and non-market values of pollination for West African farmers could help to more comprehensively determine their HH vulnerability to a decline in pollination services. This would set the stage to take more informed policy decisions to support farmers in managing landscapes effectively and sustainably to foster the multi-functionality and productivity of agricultural systems.

5. Conclusions

Rapid urbanization of West African countries is changing the nature of food systems as traditional diets based on staple foods are being replaced by more diverse horticultural products including tomato, cucumber, and strawberry. As decline in the quantity and quality of pollination services by insects, particularly within urban areas are to be expected, the development of resilient urban and peri-urban systems should consider pollinator-friendly landscape management, e.g., maintenance of nesting sites, floral resources, and habitat connectivity, as well as crop management aiming at the reduction in pesticide usage and enhanced crop diversification and crop functional trait diversity.

Supplementary Materials

The following are available online at https://www.mdpi.com/2071-1050/10/11/4253/s1, Table S1: Collected data and posed questions at individual-based interviews during the survey to evaluate income vulnerability of farming households to losses in pollination services in rural, peri-urban, and urban areas of Ouagadougou, Burkina Faso, Table S2: List of crop species with their dependence on insect pollination (minimum and maximum) for fruit and/or seed development cultivated by rural, peri-urban, and urban farmers of Ouagadougou (Burkina Faso) in 2015.

Author Contributions

K.S. (Kathrin Stenchly): Conceptualization, Methodology, Data collection; Writing—Original Draft Preparation, Statistical analysis, Validation, Review and Editing; M.V.H.: Methodology, Statistical analysis, Writing—Original Draft Preparation, Review and Editing; K.S. (Katharina Stein): Methodology, Statistical analysis, Review and Editing; A.B.: Review and Editing, Discussion of goals and scope, Project acquisition; W.L.: Supervision, Review and Editing, Funding acquisition.

Funding

This study was funded by the German Federal Ministry of Education and Research (BMBF) and the Federal Ministry for Economic Cooperation and Development (BMZ) within the framework of the UrbanFoodPlus project (www.urbanfoodplus.org) as part of the GlobE initiative (BMBF, FKZ 031A242A and 031A242B).

Acknowledgments

We thank Christoph Steiner and Désiré Jean-Pascal Lompo for their help and teamwork, Boukaré Dabilgou and Yacouba Ganamé for their assistance in field work as well as the Institut de l’Environnement et de Recherches Agricoles (INERA) for logistic support.

Conflicts of Interest

The authors declare no conflict of interest.

References

  1. Timberlake, T.; Morgan, V. Pollination and International Development: What Do We Know, What Are the Challenges and What More Can We Do? Technical Report; UK Collaborative on Development Sciences: London, UK, 2018. [Google Scholar]
  2. Smith, B.M.; Basu, P.C.; Chatterjee, A.; Chatterjee, S.; Dey, U.K.; Dicks, L.V.; Giri, B.; Laha, S.; Majhi, R.K.; Basu, P. Collating and validating indigenous and local knowledge to apply multiple knowledge systems to an environmental challenge: A case-study of pollinators in India. Biol. Conserv. 2017, 211, 20–28. [Google Scholar] [CrossRef] [Green Version]
  3. Novais, S.M.A.; Nunes, C.A.; Santos, N.B.; DAmico, A.R.; Fernandes, G.W.; Quesada, M.; Braga, R.F.; Neves, A.C.O. Effects of a possible pollinator crisis on food crop production in Brazil. PLoS ONE 2016, 11, e0167292. [Google Scholar] [CrossRef] [PubMed]
  4. Garibaldi, L.A.; Carvalheiro, L.G.; Vaissière, B.E.; Gemmill-Herren, B.; Hipólito, J.; Freitas, B.M.; Ngo, H.T.; Azzu, N.; Sáez, A.; Åström, J.; et al. Mutually beneficial pollinator diversity and crop yield outcomes in small and large farms. Science 2016, 351, 388–391. [Google Scholar] [CrossRef] [PubMed]
  5. Sanfo, S.; Barbier, B.; Zangre, A. Horticultural Production in Burkina Faso: A Comprehensive Socio-Economic Analysis. Irrig. Drain. 2017, 66, 828–841. [Google Scholar] [CrossRef] [Green Version]
  6. Tilman, D.; Clark, M.; Williams, D.R.; Kimmel, K.; Polasky, S.; Packer, C. Future threats to biodiversity and pathways to their prevention. Nature 2017, 546, 73. [Google Scholar] [CrossRef] [PubMed]
  7. Drechsel, P.; Graefe, S.; Sonou, M.; Cofie, O.O. Informal Irrigation in Urban West Africa: An Overview; International Water Management Institute (IWMI): Colombo, Sri Lanka, 2006; ISBN 9789290906421. [Google Scholar]
  8. Klein, A.M.; Vaissière, B.E.; Cane, J.H.; Steffan-Dewenter, I.; Cunningham, S.A.; Kremen, C.; Tscharntke, T. Importance of pollinators in changing landscapes for world crops. Proc. R. Soc. B Biol. Sci. 2007, 274, 303–313. [Google Scholar] [CrossRef] [PubMed] [Green Version]
  9. Hanley, N.; Breeze, T.D.; Ellis, C.; Goulson, D. Measuring the economic value of pollination services: Principles, evidence and knowledge gaps. Ecosyst. Serv. 2015, 14, 124–132. [Google Scholar] [CrossRef] [Green Version]
  10. Aizen, M.A.; Garibaldi, L.A.; Cunningham, S.A.; Klein, A.M. Long-Term Global Trends in Crop Yield and Production Reveal No Current Pollination Shortage but Increasing Pollinator Dependency. Curr. Biol. 2008, 18, 1572–1575. [Google Scholar] [CrossRef] [PubMed] [Green Version]
  11. Gallai, N.; Salles, J.M.; Settele, J.; Vaissière, B.E. Economic valuation of the vulnerability of world agriculture confronted with pollinator decline. Ecol. Econ. 2009, 68, 810–821. [Google Scholar] [CrossRef] [Green Version]
  12. FAOSTAT Statistics Database Agricultural Data/Agricultural Production/Crops Primary. Available online: http://faostat3.fao.org (accessed on 1 October 2018).
  13. Aizen, M.A.; Garibaldi, L.A.; Cunningham, S.A.; Klein, A.M. How much does agriculture depend on pollinators? Lessons from long-term trends in crop production. Ann. Bot. 2009, 103, 1579–1588. [Google Scholar] [CrossRef] [PubMed] [Green Version]
  14. IPBES. Summary for Policymakers of the Assessment Report of the Intergovernmental Science-Policy Platform on Biodiversity and Ecosystem Services On Pollinators, Pollination and Food Production; IPBES: Bonn, Germany, 2016; ISBN 9789280735673. [Google Scholar]
  15. Rader, R.; Bartomeus, I.; Garibaldi, L.A.; Garratt, M.P.D.; Howlett, B.G.; Winfree, R.; Cunningham, S.A.; Mayfield, M.M.; Arthur, A.D.; Andersson, G.K.S.; et al. Non-bee insects are important contributors to global crop pollination. Proc. Natl. Acad. Sci. USA 2016, 113, 146–151. [Google Scholar] [CrossRef] [PubMed]
  16. Olschewski, R.; Tscharntke, T.; Benítez, P.C.; Schwarze, S.; Klein, A.M. Economic evaluation of pollination services comparing coffee landscapes in Ecuador and Indonesia. Ecol. Soc. 2006, 11. [Google Scholar] [CrossRef]
  17. Stein, K.; Coulibaly, D.; Stenchly, K.; Goetze, D.; Porembski, S.; Lindner, A.; Konaté, S.; Linsenmair, E.K. Bee pollination increases yield quantity and quality of cash crops in Burkina Faso, West Africa. Sci. Rep. 2017, 7, 17691. [Google Scholar] [CrossRef] [PubMed] [Green Version]
  18. Kasina, J.M.; Mburu, J.; Kraemer, M.; Holm-Mueller, K. Economic Benefit of Crop Pollination by Bees: A Case of Kakamega Small-Holder Farming in Western Kenya. J. Econ. Entomol. 2009, 102, 467–473. [Google Scholar] [CrossRef] [PubMed]
  19. Harvey, C.A.; Rakotobe, Z.L.; Rao, N.S.; Dave, R.; Razafimahatratra, H.; Rabarijohn, R.H.; Rajaofara, H.; MacKinnon, J.L. Extreme vulnerability of smallholder farmers to agricultural risks and climate change in Madagascar. Philos. Trans. R. Soc. B Biol. Sci. 2014, 369, 20130089. [Google Scholar] [CrossRef] [PubMed]
  20. Bellwood-Howard, I.; Häring, V.; Karg, H.; Roessler, R.; Schlesinger, J.; Shakya, M. Characteristics of Urban and Peri-Urban Agriculture in West Africa: Results of An Exploratory Survey Conducted in Tamale (Ghana) and Ouagadougou (Burkina Faso); International Water Management Institute (IWMI): Colombo, Sri Lanka, 2015; Volume 163, ISBN 9290908211. [Google Scholar]
  21. Climate Data. Available online: https://de.climate-data.org/ (accessed on 1 October 2018).
  22. Stenchly, K.; Lippmann, S.; Waongo, A.; Nyarko, G.; Buerkert, A. Weed species structural and functional composition of okra fields and field periphery under different management intensities along the rural-urban gradient of two West African cities. Agric. Ecosyst. Environ. 2017, 237, 213–223. [Google Scholar] [CrossRef]
  23. QGIS Development Team. QGIS Geographic Information System; Open Source Geospatial Foundation Project: Chicago, IL, USA, 2015. [Google Scholar]
  24. Robson, E. Working girls and boys: Children’s contributions to household survival in West Africa. Geogr. J. Geogr. Assoc. 1996, 81, 403. [Google Scholar]
  25. StataCorp. Statistical Software: Release 15; StataCorp LLC: College Station, TX, USA, 2017. [Google Scholar]
  26. R Development Core Team. R: A Language and Environment for Statistical Computing; The R Foundation for Statistical Computing: Vienna, Austria, 2016. [Google Scholar] [CrossRef]
  27. Bates, D.; Mächler, M.; Bolker, B.; Walker, S. Fitting linear mixed-effects models using lme4. J. Stat. Softw. 2015, 67, 33992. [Google Scholar] [CrossRef]
  28. Kuznetsova, A.; Brockhoff, P.B.; Christensen, R.H.B. lmerTest package: Tests in linear mixed effects models. J. Stat. Softw. 2017, 82, 9070. [Google Scholar] [CrossRef]
  29. Hothorn, T.; Bretz, F.; Westfall, P. Simultaneous inference in general parametric models. Biom. J. 2008, 50, 346–363. [Google Scholar] [CrossRef] [PubMed]
  30. Paré, S.; Söderberg, U.; Sandewall, M.; Ouadba, J.M. Land use analysis from spatial and field data capture in southern Burkina Faso, West Africa. Agric. Ecosyst. Environ. 2008, 127, 277–285. [Google Scholar] [CrossRef]
  31. FAOSTAT Statistics Database. Available online: http://data.un.org/CountryProfile.aspx?crName=burkina faso (accessed on 1 October 2018).
  32. Kouamé, C.; Temple, L.; Levasseur, V.; Pasquini, M.W. A review of urban and peri-urban vegetable production in West Africa. In XXVII International Horticultural Congress-IHC2006: International Symposium on Horticultural Plants in Urban and Peri-Urban 762; ISHS: Korbeek-Lo, Belgium, 2006; pp. 245–252. [Google Scholar]
  33. Schlesinger, J.; Drescher, A.; Shackleton, C.M. Socio-spatial dynamics in the use of wild natural resources: Evidence from six rapidly growing medium-sized cities in Africa. Appl. Geogr. 2015, 56, 107–115. [Google Scholar] [CrossRef]
  34. Chagomoka, T.; Drescher, A.; Glaser, R.; Marschner, B.; Schlesinger, J.; Nyandoro, G. Contribution of urban and periurban agriculture to household food and nutrition security along the urban–rural continuum in Ouagadougou, Burkina Faso. Renew. Agric. Food Syst. 2015, 32, 5–20. [Google Scholar] [CrossRef]
  35. Bates, A.J.; Sadler, J.P.; Fairbrass, A.J.; Falk, S.J.; Hale, J.D.; Matthews, T.J. Changing bee and hoverfly pollinator assemblages along an urban-rural gradient. PLoS ONE 2011, 6, e23459. [Google Scholar] [CrossRef] [PubMed]
  36. Radford, K.G.; James, P. Changes in the value of ecosystem services along a rural-urban gradient: A case study of Greater Manchester, UK. Landsc. Urban Plan. 2013, 109, 117–127. [Google Scholar] [CrossRef]
  37. Deguines, N.; Julliard, R.; de Flores, M.; Fontaine, C. Functional homogenization of flower visitor communities with urbanization. Ecol. Evol. 2016, 6, 1967–1976. [Google Scholar] [CrossRef] [PubMed] [Green Version]
  38. Luder, K.; Knop, E.; Menz, M.H.M. Contrasting responses in community structure and phenology of migratory and non-migratory pollinators to urbanization. Divers. Distrib. 2018, 24, 919–927. [Google Scholar] [CrossRef]
  39. Langellotto, G.A.; Melathopoulos, A.; Messer, I.; Anderson, A.; McClintock, N.; Costner, L. Garden pollinators and the potential for ecosystem service flow to urban and peri-urban agriculture. Sustainability 2018, 10, 2047. [Google Scholar] [CrossRef]
  40. Wortmann, C.S. Atlas of Common Bean (Phaseolus vulgaris L.) Production in Africa; No. 297; CIAT: Cali, Colombia, 1998. [Google Scholar]
  41. Mueller, N.D.; Gerber, J.S.; Johnston, M.; Ray, D.K.; Ramankutty, N.; Foley, J.A. Closing yield gaps through nutrient and water management. Nature 2012, 490, 254. [Google Scholar] [CrossRef] [PubMed]
  42. Steward, P.R.; Shackelford, G.; Carvalheiro, L.G.; Benton, T.G.; Garibaldi, L.A.; Sait, S.M. Pollination and biological control research: Are we neglecting two billion smallholders. Agric. Food Secur. 2014, 3, 5. [Google Scholar] [CrossRef]
  43. Benjamin, F.E.; Winfree, R. Lack of Pollinators Limits Fruit Production in Commercial Blueberry (Vaccinium corymbosum). Environ. Entomol. 2014, 43, 1574–1583. [Google Scholar] [CrossRef] [PubMed]
  44. Hudewenz, A.; Pufal, G.; Bögeholz, A.L.; Klein, A.M. Cross-pollination benefits differ among oilseed rape varieties. J. Agric. Sci. 2014, 152, 770–778. [Google Scholar] [CrossRef]
  45. De Neergaard, A.; Drescher, A.W.; Kouamé, C. Urban and peri-urban agriculture in African cities. In African Indigenous Vegetables in Urban Agriculture; Routledge: Abingdon-on-Thames, UK, 2009; pp. 67–96. [Google Scholar]
Figure 1. Proportion of produce in relation to cultivated land categorized into different degrees of insect pollination dependency for fruit development that were cultivated within rural, peri-urban, urban open-space, and backyard farming systems in Ouagadougou (Burkina Faso) in 2015. Boxplots show the lower quartile, median, and upper quartile, with whiskers extending to the most extreme data point which is no more than 1.5 times the interquartile range from the edge of the box.
Sustainability 10 04253 g001
Figure 2. Potential relative reduction through total pollinator loss in rural, peri-urban, and urban farmer households’ agricultural revenue generated through the cultivation of okra (Abelmoschus esculentus (L.) Moench) in Ouagadougou (Burkina Faso) based on data collected in 2015. Boxplots show mean (black dot), the lower quartile, median, and upper quartile, with whiskers extending to the most extreme data point that is no more than 1.5 times the interquartile range from the edge of the box. Different letters indicate significant differences between groups with p ≤ 0.05.
Sustainability 10 04253 g002
Table 1. Average field size and average yield of crops found in rural (R), peri-urban (P), urban backyard (UB), and open-space (UO) farming systems of Ouagadougou in 2015 that benefit from insect pollination for fruit development and that are cultivated for either self-consumption or the market.
Crop SpeciesAverage Field Size [in ha]Average Yield [in t/ha]Market Production [in %]
RPUBUORPUBUORPUBUO
Black-eyed peas 0.3950.314 0.90.7 50
Cucumber 0.2530.134 51.8 90100
Green bean0.5310.2680.374 4.52.20.5 151015
Okra0.0410.0530.0820.1601592.7310102590
Pepper0.0300.101 0.1887.513 3.295100 100
Sesame0.3400.270 24.5 8545
Strawberry 0.105 8 100
Tomato0.0020.0030.048 40908 1009595
Watermelon0.114 9 90
Table 2. Minimum and maximum values of the mean (± SD) household vulnerability index (HVI) for pollinator loss of rural, peri-urban, and urban households involved in agricultural activities in Ouagadougou (Burkina Faso), 2015.
RuralPeri-urbanUrban
n = 32n = 61Backyard n = 43Open-Space n = 87
Mean HVIMin−0.01 ± 0.02−0.01 ± 0.02−0.03 ± 0.08−0.03 ± 0.06
Mean HVIMax−0.04 ± 0.04−0.02 ± 0.04−0.07 ± 0.12−0.10 ± 0.15

